Tool Bar
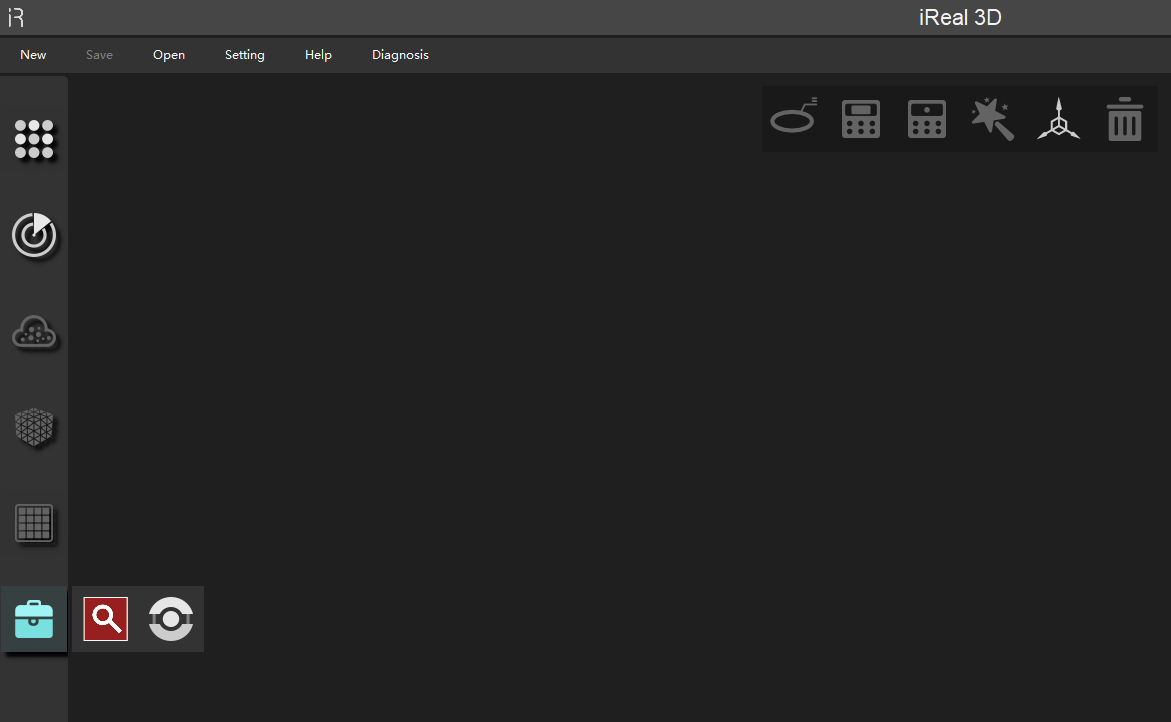
The toolbar accompanies our entire workflow, from scanning to post-processing to exporting. Let’s introduce them one by one.
Interface |
Icon |
Name |
Description |
|---|---|---|---|
Scan |
|
Based on your scanning requirement, change the scanning parameters. |
|
|
On: 3D view moves with the scanner; Off: 3D view does not move with the scanner |
||
|
Red: point cloud quality is not high; Green: point cloud density meets the current resolution requirements |
||
|
Better scanning of hair after activation |
||
|
It can automatically choose the wrong data and manually delete it when having scan errors. |
||
|
Finish |
Finish scanning |
|
PointCloud |
|
Isolated Points |
The isolated points around the model can be found and deleted manually. |
|
Disconnected Components |
The area separated from the main body can be found and deleted manually. |
|
|
Wrap |
Process the point cloud data into a mesh |
|
|
Mesh Simplify |
Reduce the current mesh data to 60% |
|
|
Mesh Refine |
Increase the current mesh by 3 times |
|
|
Manually click the boundary to fill holes according to curvature |
||
|
Change the model display material |
||
|
Mapping |
Map according to photos, no map in LED-Off mode or single color scanning |
|
Mapping |
|
Adjust the hue and saturation and etc. |
|
Tools |
|
Import to GOM Inspect |
One-button connection to GOM Inspect |
|
Align 2 point cloud files or projects to a point cloud file or project |
||
|
Draw a line to measure the girth |
||
|
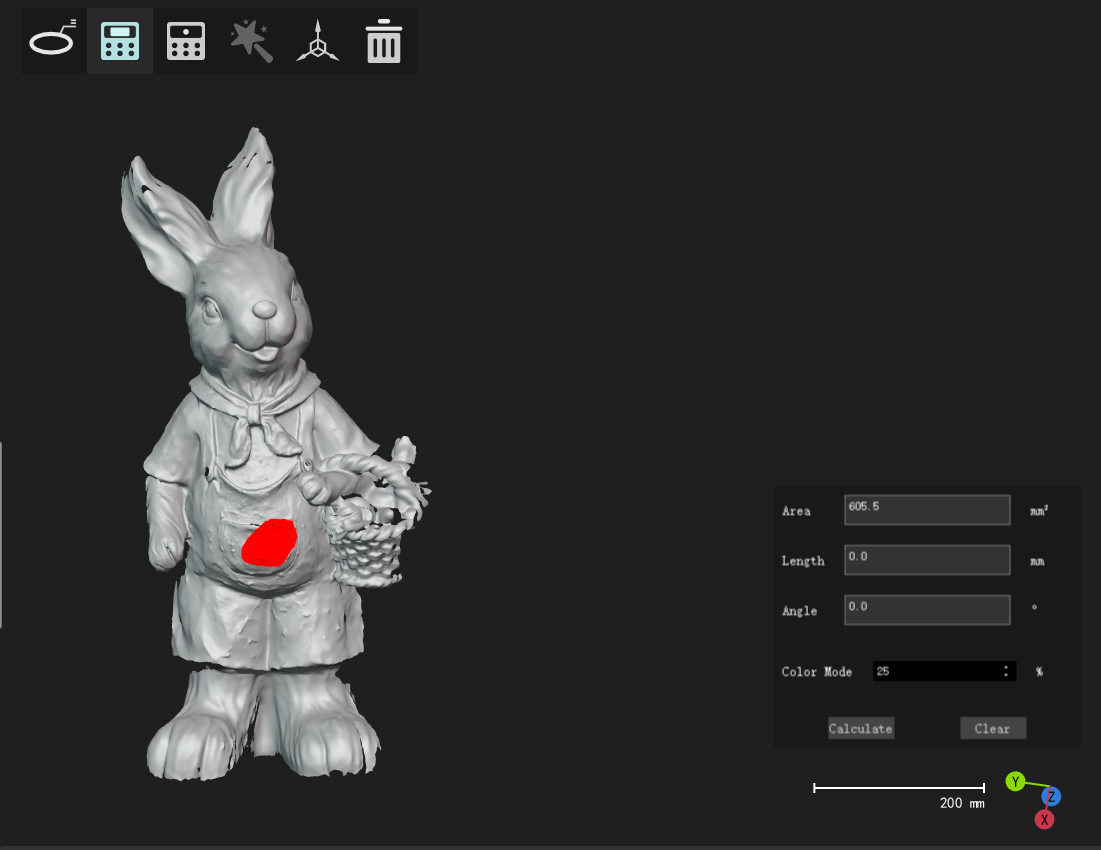
Select surface and calculate its area |
||
|
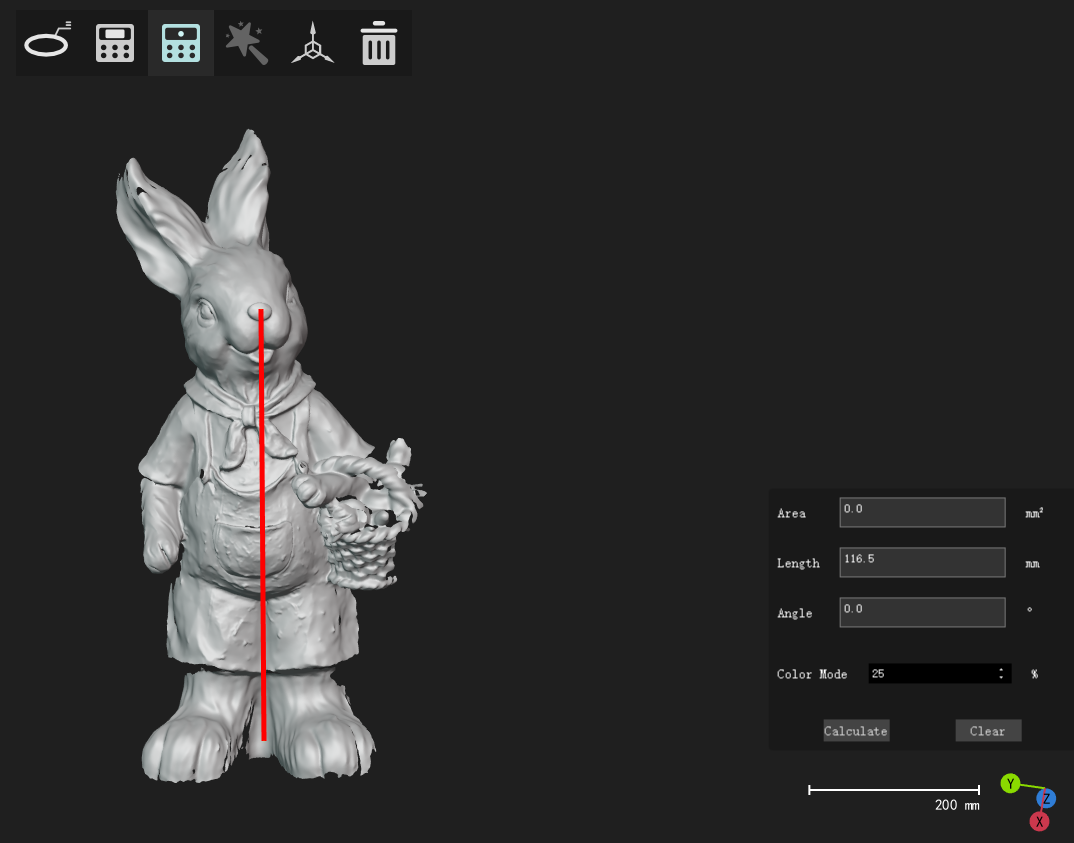
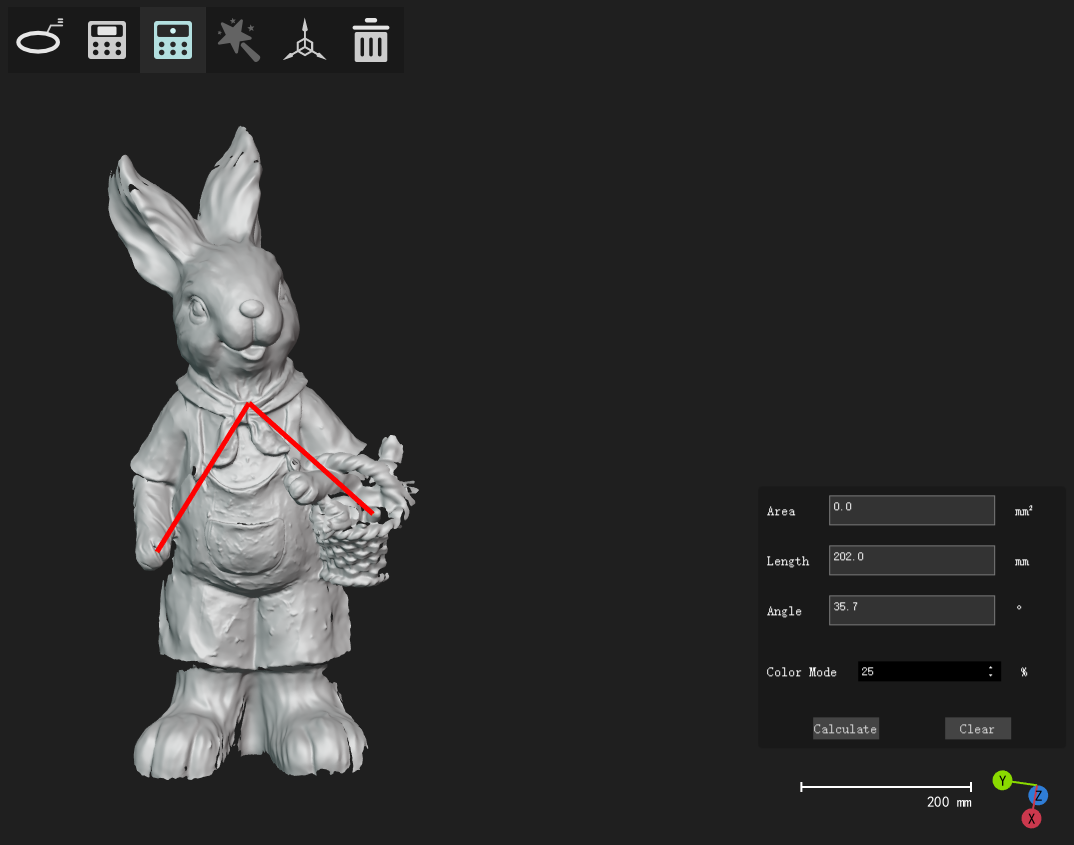
Select 2 points to calculate their distance, select 3 points to calculate their angle |
||
|
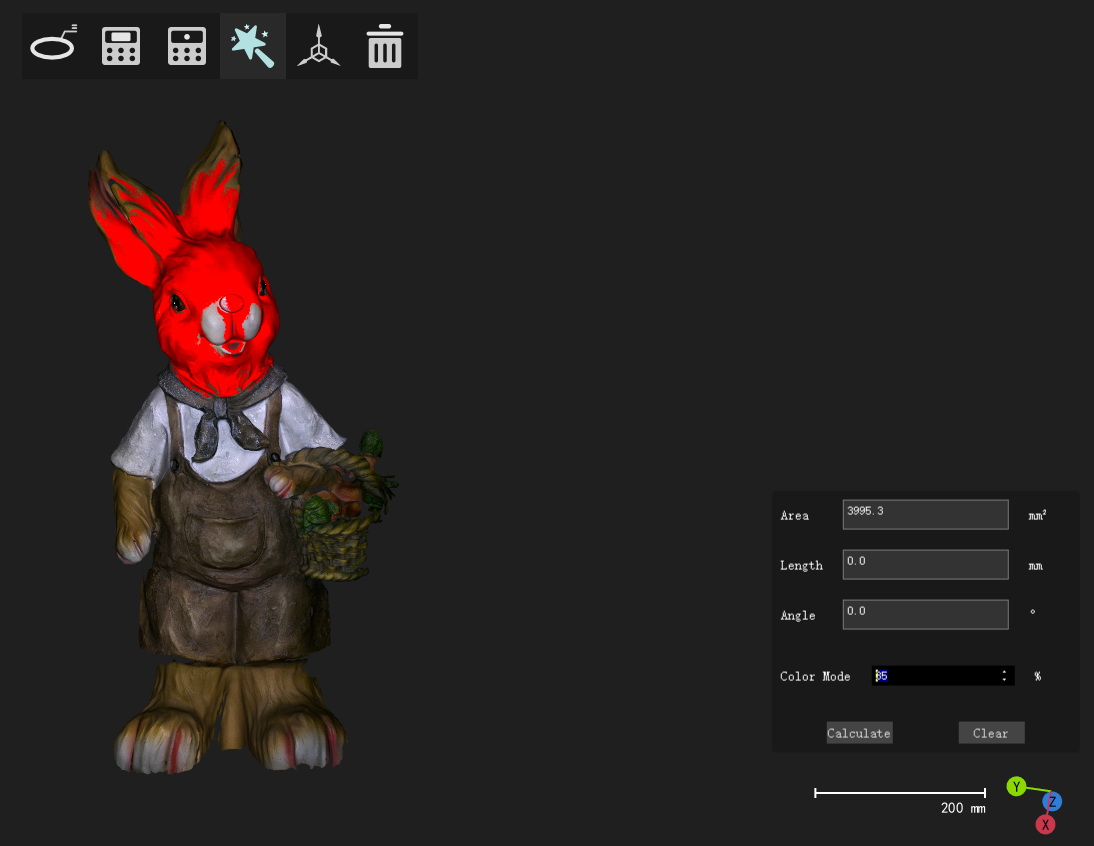
Select an area based on its color, and calculate its area |
||
|
Create coordinate system |
Select an angle, click this icon and export its coordinate. |
|
|
Clear |
Clear |
 Real-time Scanning Parameters Settings
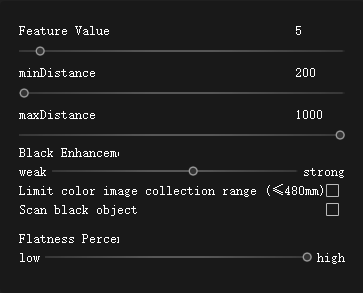
Feature Value: Range: 0-100; Default: 5
This parameter only affects the splicing success rate in Feature Splicing mode.
The programmer evaluates all objects to distinguish between strong features and weak features. If the value is adjusted to 30, only features that reach 30 will participate in splicing, then weak features below 30 will be ignored. Generally, weak features are easy to be identified incorrectly, leading to splicing errors.
The increase will improve the accuracy of splicing, but also make the splicing harder.
It can be used in feature/mixed splicing.
Observe the real-time feature value
 in the lower left corner of the status bar to learn more about common objects’ feature value.
Scanning Distance: 280mm-1000mm, 720mm total.
This parameter is set to control the scanning depth of field within a reasonable range. It can ensure better details while scanning smoothly, and also limit the farthest/nearest scanning distance to filter the surrounding debris.
The closer the distance is, the better the detail will be, making more areas turn green under the function of Data Quality Color Map, but also reducing the splicing smoothness.
The farther the distance is, the poorer the detail is, making more areas turn red under the function of Data Quality Color Map, and the splicing will be more smooth.
In any mode, we can click the Real-time Scanning Parameters Settings to change the scanning distance.
Add New Markers : Hidden by Default
This parameter is only for the Marker Splicing model. After activation, it can identify the new markers to make splicing more smooth.
Black Enhancement: Weak - Strong
This parameter affects the amount of black object’s point cloud. The higher the value is, the easier it is to scan black objects. Therefore, if scanning black objects, please adjust this item in time.
Limit Color Image Collection Range : Not activated
Turn on the function to allow the color camera to work under the appropriate scanning distance, avoiding obtaining poor-quality images.
When it is turned on, you can make the color camera take pictures only at the right distance to prevent getting poor-quality images and affecting the whole model. When color is selected as the color model, the color of the object will be captured only when the scanning distance is 250mm-450mm, then the 3D window real-time scanning screen will be blue, too far and too close will have no mapping, and the 3D window real-time scanning screen will be black, this option requires a high scanning technique, check it according to the actual need.
This parameter has higher requirements for scanning technique, please select based on your real situation.
 Filed of View
On: Default
The 3D window moves with the scanner so that during the scanning, we can quickly know where we are scanning.
Off:
The 3D window will not move during 3D scanning that is suitable for targeted scanning in the final complementary scanning phase so that the focus will not be affected by the automatic window movement.
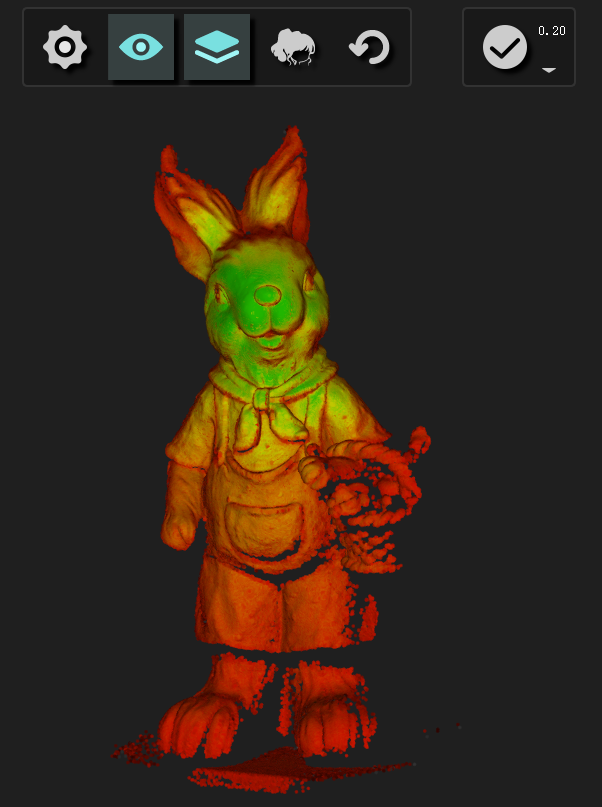
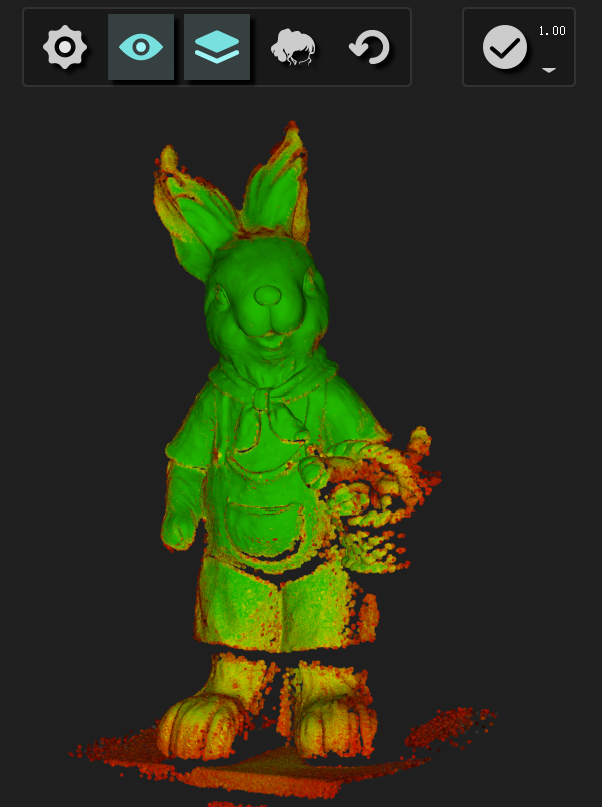
 Data Quality Color Map
- Why do we have Data Quality Color Map?
We need to know that to be rich in detail, you need to scan close up and for a long time.
It’s easy to see whether you get too close because it will fail to scan. But how can we know the standard of “long-time scanning”?
At this time, the Data Quality Color Map can help us check the 3D scanned data.
- How to use Data Quality Color Map?
We know that after scanning you still can change the resolution. For details, see After Scanning .
After changing the resolution, don’t rush to click Finish. Click the Data Quality Color Map to check that the whole data is covered by the green to red chromatograms. Based on this, we can decide whether to continue scanning.
With more red areas: The data quality is not good and the point cloud density is lower than the current resolution.
With more green areas: The data quality is good and the point cloud density is the same as the current resolution.
After wrapping, the green data is good, while the red data will be orange peel-like.
Hint
Suggestion: When scanning humans, please do not use Data Quality Color Map. Because people will move, the data will be double-layer. During real-time scanning, the longer time you scan, the more red data you will see.
- The relationship between Data Quality Color Map and resolution
When opening the function, we can easily find that the same 3D data will be shown in different colors under various resolutions.
The data shows a few areas with green under the resolution of 0.2, while the area will increase when changing to the resolution of 1.0.
This is because the higher-resolution model has higher requirements for details, so the areas that could barely meet the standard before will instantly fail to meet the requirements.
- Summary:
So we can judge whether the data quality is qualified under the target resolution based on the color values provided by the chromatographic display, if not, just open the scanner and continue scanning.
 Hair Enhancement
In human body scanning mode, it is activated by default.
Human hair is the most special, it’s thin and messy. In the past, there were few scanners that could scan hair. Even now, not all hair is suitable for scanning. Don’t forget to use the function of Hari Requirements when you want to scan hair.
 Retract frame
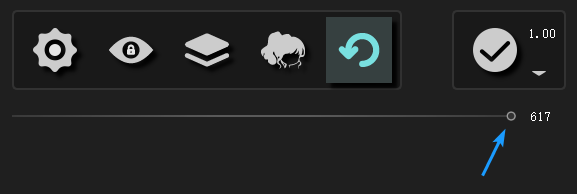
When there is an error in splicing, you can stop scanning, click the retract frame icon (shown right), pull the ball to the left, and recall up to 100 frames each time. And we can withdraw continuously, even back to the scanning starts.
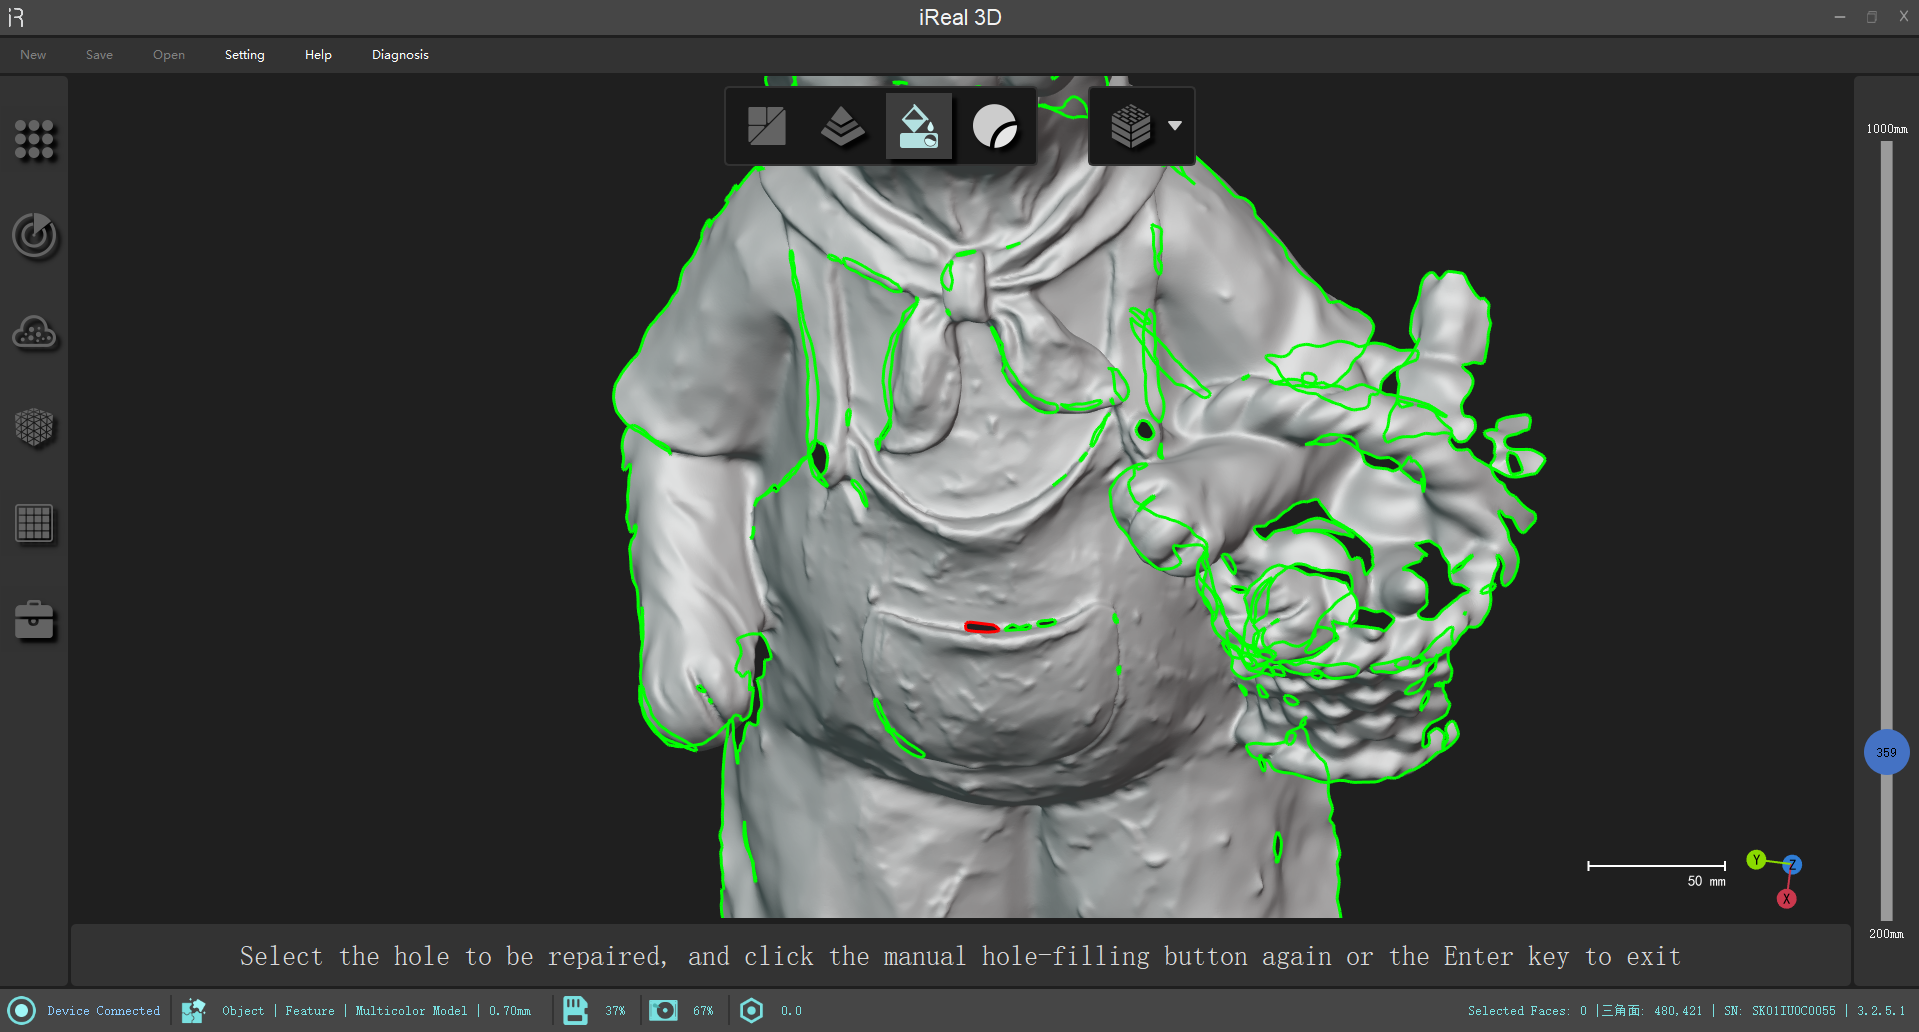
 Manual hole filling
After activation, mouse over the green hole, the hole will become red and the hole will be filled automatically according to the curvature after clicking, if you are not satisfied with the effect of filling the hole, you can press Ctrl+Z to withdraw.
Press Enter or click the``Manual Hole Filling`` icon again to exit the mode.
 Matcap
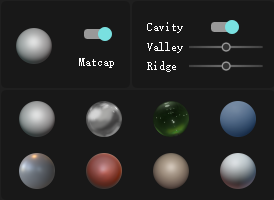
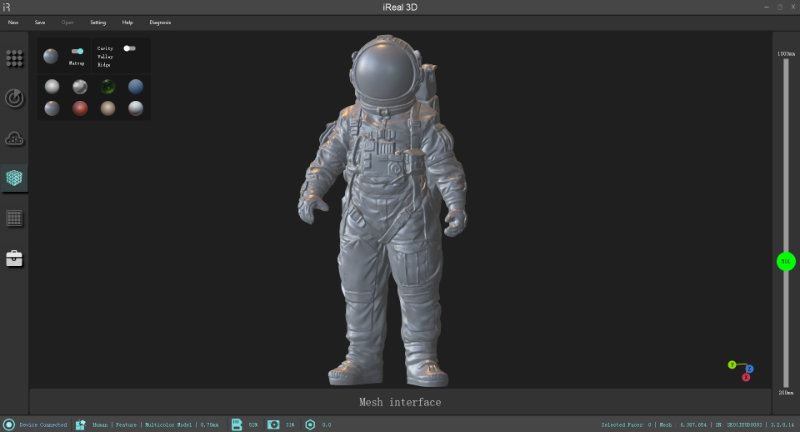
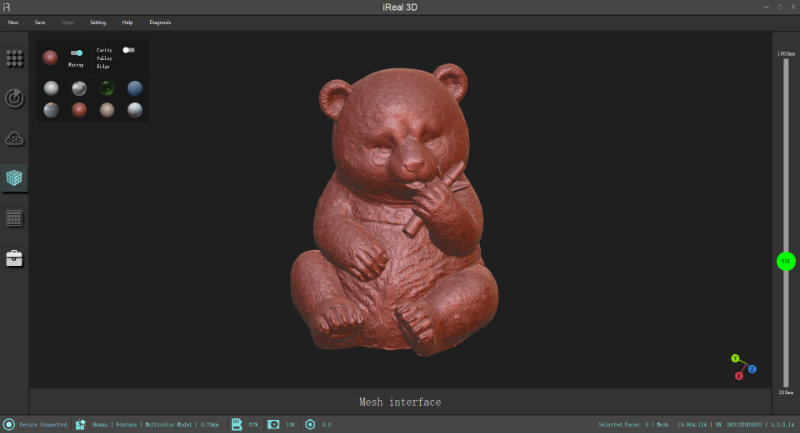
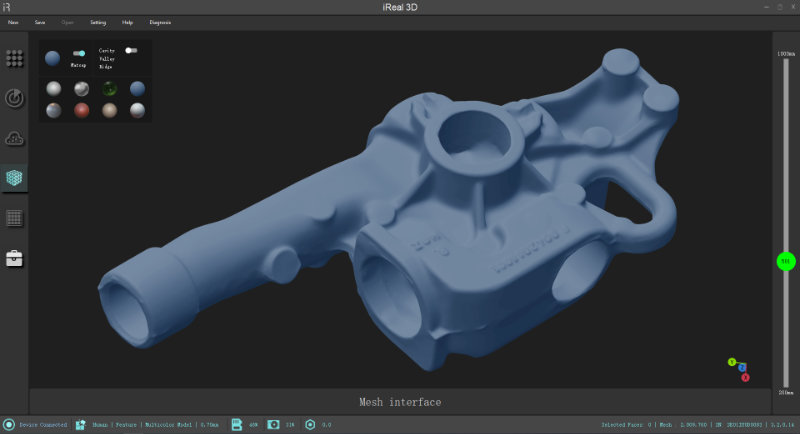
The Matcap allows you to change the material display of the STL model. 8 different materials enable the 3D model to be displayed in a more varied and more interesting form. By adjusting the valley and ridge, the model can show different artistic details and be more three-dimensional.
Cavity: Off by default
Ridge: make the concave part of the 3D model darker;
Valley: make the convex part of the 3D model brighter.
 Texture Adjustment
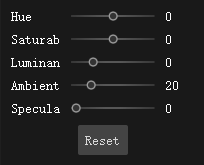
Hue: Change the hue of the texture itself, such as changing it from red to blue. You can adjust the value slightly when the color is distorted.
Saturation: When the saturation is 0, the texture is black and white; when the saturation is too high, there will be noise.
Luminance: Increase the brightness of the texture as a whole.
Ambient: Ambient light brightness, texture itself has not changed.
Specula: Change the reflective intensity of the model. The first three will change the texture itself, the rest two won’t.
Note: The three options Hue, Saturation, and Brightness affect the mapping effect of the model, while Ambient Light and Specular Light are only visible in the software.
 Measuring Girth
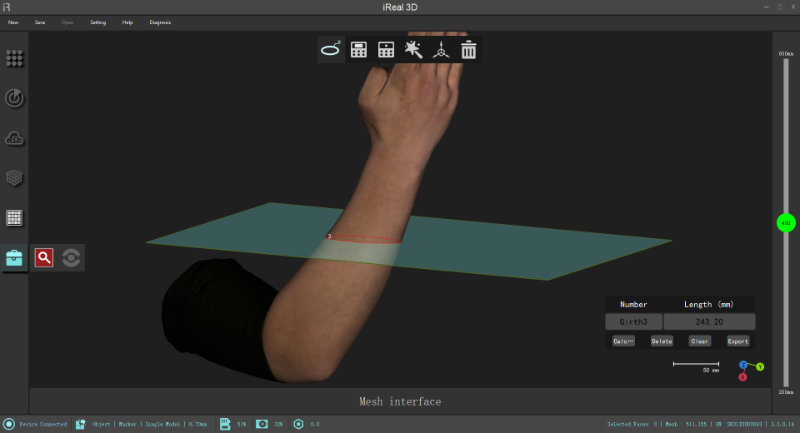
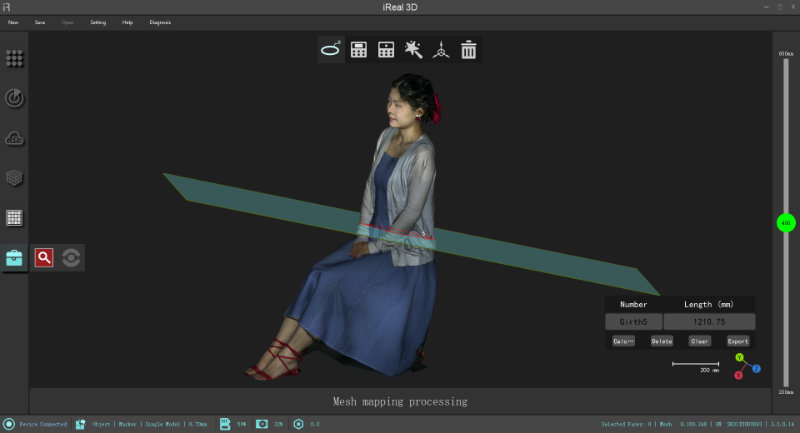
Draw a line on the model (left-click the mouse), and automatically generate a cross-section, which can automatically calculate the girth of the cross-section. For example, draw a line on the waist/head, and the corresponding waist/head perimeter can be automatically calculated.
 Model Alignment
Align 2 point cloud files or projects to a point cloud file or project
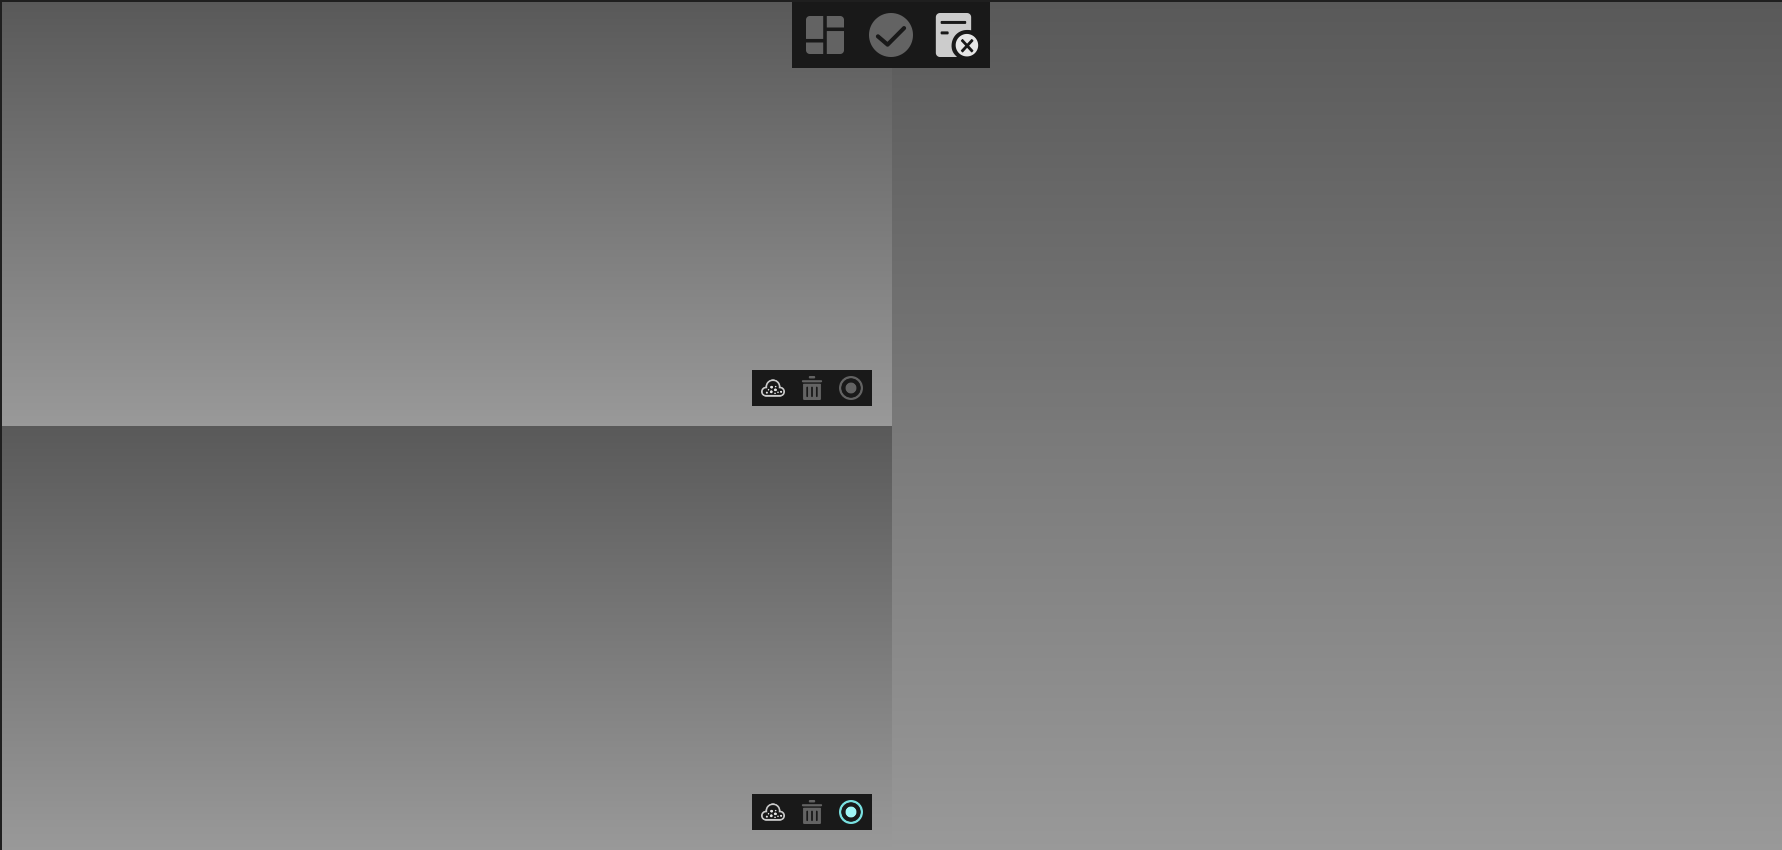
Prepare point cloud A&B, open the model alignment interface (Shown below)
Import them to the left windows
Find more than 3 common points between A and B. If you click wrong, you can delete them and try again;
Click the Fine alignment button
 first and then click the Finish button
  .
.
Video: How to do data stitching completely and flawlessly Click to watch.


